
GRAVES REALTY · HISTORICAL MARKET REPORTS
Stillwater market archive.
Original market commentary from 2023 and 2024, preserved for readers returning to the older reports. These figures and forecasts describe their publication periods and should not be used as a current pricing assessment.
Request a current home pricing review · Explore Stillwater today
- Stillwater Real Estate Market Update (May 2024)
- Stillwater, MN Real Estate Market Update (February 2024)
- Stillwater, MN Real Estate Market Update (January 2024)
- Stillwater, MN Real Estate Market Update (December 2023)
- Stillwater, MN Real Estate Market Update (November 2023)
- Stillwater, MN Real Estate Market Update (October 2023)
- Stillwater, MN Real Estate Market Update (September 2023)
- Stillwater, MN Real Estate Market Update (August 2023)
Stillwater Real Estate Market Update (May 2024)
Stillwater Real Estate Market Update
Welcome to my May 2024 update on the Stillwater, MN real estate market. In this edition, we’ll explore the latest trends and changes that have shaped the local real estate landscape, offering insights into what buyers and sellers can expect in the coming months.
Market Overview
This past month, Stillwater saw a slight decrease in new listings compared to the previous year, with 22 new listings in March 2024, marking a 15.4% drop. Despite this, closed sales have shown a robust increase, rising by 50% from 12 sales in March 2023 to 18 in March 2024. This dynamic suggests a competitive market where high demand continues to absorb available inventory swiftly.
Pricing Trends
The median sales price in Stillwater has seen a noteworthy increase, climbing to $530,000 in March 2024, up from $485,950 in the previous year, a 9.1% rise. Similarly, the average sales price slightly increased by 1.3% to $537,194. The price per square foot also grew significantly, from $228 to $258, indicating a strong buyer willingness to pay premium prices for desirable properties.
Market Dynamics
The inventory of homes has seen an increase, rising by 24.3% to 46 homes available on the market. Correspondingly, the months’ supply of inventory rose significantly by 53.8%, from 1.3 months in March 2023 to 2.0 months in March 2024. This change reflects a slightly more balanced market, giving buyers more options than in the previous year. However, the days on the market until sale also increased to 69 days, up from 55, suggesting that while more homes are available, they are taking longer to sell.
New Listings Overview for March 2024:
| Detail | Data |
|---|---|
| Median List Price | $567,500 |
| Number of Properties | 32 |
| Median Living Area | 2,921 Sqft |
Active Listings Snapshot for March 2024:
| Detail | Data |
|---|---|
| Median List Price | $850,000 |
| Number of Properties | 45 |
| Median Living Area | 3,621 Sqft |
Buyer and Seller Behavior
The percentage of the original list price received by sellers slightly decreased to 98.6% from a flat 100%, showing that buyers are negotiating more aggressively than in the past. This trend could be indicative of buyers gaining leverage in negotiations as the market stabilizes.
Conclusion
The Stillwater real estate market is experiencing a mix of trends, with rising prices and an increasing inventory, presenting new opportunities and challenges for both buyers and sellers. As we move into the summer months, which traditionally see increased activity, it will be interesting to observe how these dynamics evolve. If you’re considering buying or selling in Stillwater, or just need more detailed information, don’t hesitate to contact me. Let’s discuss how you can best navigate this market!
FAQs
What is the best time of year to buy a house in Stillwater?
Traditionally, spring and early summer see the most activity, but with changing market dynamics, opportunities can arise at any time.
Are prices expected to continue rising in Stillwater?
While current trends show an increase in prices, market conditions can shift, influencing future pricing.
What does an increase in days on the market imply for buyers?
An increase in days on the market typically suggests that buyers have more negotiating power and a broader selection of homes to choose from.
Stillwater, MN Real Estate Market Update (February 2024)
Summary
As we progress into February 2024, the Stillwater, MN real estate market continues to show strength and vitality. With a slight decrease in the months of inventory and an increase in the list-to-sold price percentage, the market dynamics suggest a favorable environment for sellers. This update delves into the latest trends and figures shaping the single-family home market in this thriving community.
Table of Contents
- Market Momentum Continues
- Property Value Trends
- Insights into New and Active Listings
- Analyzing Pending and Sold Listings
- Inventory Challenges and Opportunities
- Conclusion: Navigating the Market
- Frequently Asked Questions
Market Momentum Continues
February brings a continued seller’s market in Stillwater, with a months of inventory figure of 1.78, indicating high demand. The list-to-sold price ratio exceeding 100% showcases buyers’ willingness to pay above asking prices, a clear indicator of competitive market conditions.
Property Value Trends
Property values have slightly adjusted, with the median estimated value at $516,090, reflecting the market’s ongoing adjustments and the enduring appeal of Stillwater living.
Insights into New and Active Listings
This month saw an intriguing uptick in median list prices for new and active listings, signaling robust seller confidence and a market ripe for high-value transactions.
New Listings Overview:
| Detail | Data |
|---|---|
| Median List Price | $567,500 |
| Number of Properties | 32 |
| Median Living Area | 2,921 Sqft |
Active Listings Snapshot:
| Detail | Data |
|---|---|
| Median List Price | $850,000 |
| Number of Properties | 45 |
| Median Living Area | 3,621 Sqft |
Analyzing Pending and Sold Listings
February’s pending and sold listings reinforce the market’s vitality, with sold prices reflecting a significant month-over-month increase and properties moving quickly from listing to sale.
Inventory Challenges and Opportunities
The slight reduction in the months’ supply of inventory to 1.78 suggests a tighter market, potentially leading to quicker sales but also highlighting the need for more listings to satisfy buyer demand.
Conclusion: Navigating the Market
Stillwater’s real estate market in February 2024 presents a promising landscape for sellers and a competitive arena for buyers, emphasizing the importance of strategic market navigation. Contact me today with any questions.
Statistics for this market update were sourced from the National Association of Realtors’ Realtors Property Resource® (RPR). For more detailed information, please visit narrpr.com.
Frequently Asked Questions
Is February a good time to sell in Stillwater, MN?
Yes, February’s market conditions, highlighted by above-asking sale prices and low inventory, make it an opportune time to sell.
How are new listings performing in Stillwater’s market?
New listings are entering the market at higher price points, indicating a strong seller’s market with potential for significant returns.
What do the current trends indicate for buyers in Stillwater?
Buyers face a competitive market with rising prices and quick sales, highlighting the importance of readiness and flexibility in offer-making.
Stillwater, MN Real Estate Market Update (January 2024)
Summary
Stillwater MN Real Estate Market Update January 2024, is off to a warm start, both meteorologically and in the real estate market. Record high temperatures might be hinting at an equally hot real estate market, kicking off earlier than usual. With significant movements in inventory, pricing, and days on market, this update delves into the latest trends affecting single-family homes in this picturesque locale.
Table of Contents
- A Warm Market in a Cold Month
- Property Value and Market Dynamics
- New and Active Listings Insights
- Pending and Sold Listings Overview
- Looking Ahead: Inventory and Supply
- Market Summary and Forward Look
- Frequently Asked Questions
A Warm Market in a Cold Month
As Stillwater experiences unusually high temperatures for January, the real estate market is mirroring this warmth. With a steady seller’s market indicated by 1.91 months of inventory and a median sold price leap to $533,250, conditions are ripe for an early and active season.
Property Value and Market Dynamics
Despite a slight cooling in median estimated property values to $519,570, the market retains its vigor. This adjustment might reflect a normalizing trend after the intense growth observed in recent months.
New and Active Listings Insights
December’s listings brought a surprising twist with a sharp increase in median list price for active listings to $949,900, despite a reduction in new listings. This suggests that high-value properties are becoming more prevalent in Stillwater’s inventory.
New Listings Overview:
| Detail | Data |
|---|---|
| Median List Price | $339,500 |
| Number of Properties | 9 |
| Median Living Area | 2,634 Sqft |
Active Listings Snapshot:
| Detail | Data |
|---|---|
| Median List Price | $949,900 |
| Number of Properties | 45 |
| Median Living Area | 4,027 Sqft |
Pending and Sold Listings Overview
The transition from pending to sold listings shows a robust market with a high average list to sale price percentage of 98.62%. The quick turnover time of 33 days in RPR further emphasizes the market’s strength.
Looking Ahead: Inventory and Supply
The months’ supply of inventory remaining steady at 1.91 points towards a consistent demand. However, the market is showing signs of preparing for an influx of buyers possibly spurred by the early warm weather.
Market Summary and Forward Look
Stillwater’s real estate market in January 2024 suggests an early spring awakening, with high sold prices and an active market despite fewer new listings. This could be the year we see a shift in traditional market timing, influenced by both environmental and economic factors.
Conclusion
As we navigate the evolving landscape of Stillwater’s real estate market, staying informed will be key to seizing opportunities and making informed decisions. For the latest insights and a detailed analysis tailored to your needs, don’t hesitate to reach out. Contact me now!
Statistics for this market update were sourced from the National Association of Realtors’ Realtors Property Resource® (RPR). For more comprehensive information, visit narrpr.com.
Frequently Asked Questions
Is Stillwater’s real estate market expected to remain a seller’s market?
Given the current trends, Stillwater is likely to remain a seller’s market into the early months of 2024, with strong demand and competitive pricing.
How are the record high temperatures affecting the real estate market?
The unseasonably warm weather may be encouraging more activity in the real estate market earlier than usual, potentially leading to an earlier start to the traditionally busy spring season.
Are we seeing a shift in the types of properties being listed?
Yes, the increase in median list prices, especially for active listings, suggests that more high-value properties are entering the market, possibly indicating a shift in market dynamics towards more luxury listings.
Stillwater, MN Real Estate Market Update (December 2023)
Summary
December 2023 in Stillwater, MN, brought a dynamic shift in the real estate market, especially for single-family homes, condos, townhouses, and apartments. The market experienced significant changes in inventory, sold prices, and listing dynamics, painting a vivid picture of current trends and future expectations.
Table of Contents
- A Transformative Market Landscape
- Property Value Insights
- Listing Dynamics
- Pending and Sold Listings
- Inventory and Market Supply
- Simplified Takeaways
- Frequently Asked Questions
A Transformative Market Landscape
December in Stillwater, MN, marked a notable transition in the real estate market. The months of inventory decreased significantly to 1.91, reinforcing a strong seller’s market, but with a 16.59% decrease month over month, indicating a shift towards balance. The list-to-sold price percentage remained high at 98.6%, showing continued demand.
Key Market Indicators:
- Months of Inventory: 1.91
- List to Sold Price %: 98.6%
- Median Days in RPR: 33
- Median Sold Price: $533,250
Property Value Insights
The median estimated value for properties in Stillwater experienced a slight decrease, settling at $462,550. This change reflects the evolving dynamics of the local real estate market.
Listing Dynamics
New listings in December saw a notable shift, with the median list price dropping to $315,000. The total volume of new listings also decreased, indicating a potential cooling off in market activity as we approach the year’s end.
New Listings Overview:
| Detail | Data |
|---|---|
| Median List Price | $315,000 |
| Number of Properties | 15 |
| Median Living Area | 1,850 Sqft |
Active Listings Snapshot:
| Detail | Data |
|---|---|
| Median List Price | $724,450 |
| Number of Properties | 56 |
| Median Living Area | 3,392 Sqft |
Pending and Sold Listings
December’s pending and sold listings provide insight into the end-of-year market movements. The median list price for pending listings was $412,450, while the median sold price was notably higher at $467,000.
Inventory and Market Supply
The supply of inventory, measured in months, showed a decrease to 1.84, indicating a more competitive market. This trend is reflected across various property types in Stillwater.
Simplified Takeaways
The Stillwater real estate market in December 2023 experienced a blend of decreasing inventory and high demand, particularly for single-family homes. While the median sold prices rose significantly, the market also showed signs of balancing as the year ended.
For a more in-depth analysis or to discuss how these trends affect your real estate goals in Stillwater, contact me now. Let’s navigate this dynamic market together and find the best path for your real estate journey.
Stay tuned for the next monthly update, where we’ll continue to keep you informed on the pulse of the Stillwater real estate market.
Statistics for this market update were sourced from the National Association of Realtors’ Realtors Property Resource® (RPR). narrpr.com
Frequently Asked Questions
Is Stillwater, MN a buyer’s or seller’s market?
As of December 2023, Stillwater remains predominantly a seller’s market, characterized by low inventory and high demand, though there are signs of shifting towards a more balanced market.
Are property values increasing in Stillwater, MN?
December saw a minor decrease in the median estimated property value, but overall, property values have shown resilience and growth over the past year.
How quickly are homes selling in Stillwater, MN?
Homes in Stillwater are selling relatively quickly, with a median of 33 days on the market, which is a slight increase from the previous month.
Stillwater, MN Real Estate Market Update (November 2023)
Summary
November 2023 sees significant changes in Stillwater’s real estate market, particularly for single-family homes, condos, townhouses, and apartments. With a decrease in inventory and an increase in median sold prices, the market dynamics are shifting, presenting new opportunities for buyers and sellers alike. This update offers a detailed analysis of these trends.
Table of Contents
- An Evolving Market Landscape
- Property Value Trends
- The Dynamics of New and Active Listings
- The Story of Pending and Sold Listings
- Inventory and Market Supply
- Simplified Takeaways
- Frequently Asked Questions
As we delve into the November 2023 real estate market trends for Stillwater, MN, we observe some interesting shifts and movements, particularly in the single-family, condo, townhouse, and apartment sectors. This update aims to provide a comprehensive look at what these changes mean for buyers and sellers in this vibrant community.
An Evolving Market Landscape
November has painted a dynamic picture for the real estate market in Stillwater. With a notable shift in several key areas, the market dynamics are subtly changing, shaping new opportunities and challenges for market participants.
Key Market Indicators
- Months of Inventory: Down to 1.97, a significant decrease of 27.04% month over month, indicating a faster-moving market.
- List to Sold Price Ratio: Average list to sale price decreased to 98.2%, a drop of 3.41% from the previous month.
- Median Days in RPR: Properties now spend an average of 47 days on the market, a substantial increase from the previous month.
- Median Sold Price: The median sold price sees a slight increase to $378,950, a 1.09% rise month over month.
Property Value Trends
As we examine the property value trends, there’s a slight dip in the median estimated value of properties, now standing at $474,180. This represents a marginal decrease of 0.2% from last month, but an overall increase of 1.1% over the past year.
The Dynamics of New and Active Listings
November’s market shows a decrease in the number of new listings but an increase in their median list price. Conversely, active listings have increased in number, with a notable rise in median list price and living area.
New Listings Overview
| Detail | Data |
|---|---|
| Median List Price | $398,975 |
| Number of Properties | 18 |
| Median Living Area | 2,292 Sqft |
Active Listings Snapshot
| Detail | Data |
|---|---|
| Median List Price | $649,000 |
| Number of Properties | 61 |
| Median Living Area | 3,306 Sqft |
The Story of Pending and Sold Listings
Despite the fluctuations in new and active listings, pending sales and sold listings present a different picture. The median list price for pending listings saw an increase, as did the total dollar volume, indicating a robust interest in the market.
Sold Listings: The Final Picture
The sold listings in November show a stable market with a healthy number of properties sold, albeit with a longer median time on the market.
Inventory and Market Supply
The months supply of inventory has decreased significantly, signaling a more competitive market for buyers and a favorable scenario for sellers. This decrease in inventory, combined with the increase in the median list price of active listings, suggests a market where demand remains strong.
Simplified Takeaways
In summary, the Stillwater real estate market in November 2023 has seen an interesting mix of trends. Properties are spending more time on the market, but the overall market activity remains vigorous. Sellers are seeing favorable conditions, while buyers are facing a more competitive landscape with fewer options and higher prices.
For a more in-depth analysis or to discuss how these trends affect your real estate goals in Stillwater, contact me now. Let’s navigate this dynamic market together and find the best path for your real estate journey.
Stay tuned for the next monthly update, where we’ll continue to keep you informed on the pulse of the Stillwater real estate market.
Statistics for this market update were sourced from the National Association of Realtors’ Realtors Property Resource® (RPR). For more detailed information, please visit narrpr.com.
Frequently Asked Questions
Is it expensive to live in Stillwater, MN?
Living in Stillwater, MN, can be considered moderately expensive, particularly in the real estate sector. With a median sold price of $378,950 in November 2023, housing costs are significant but comparable to surrounding areas in Washington County, where the median sold price was $415,000.
Is it a buyer’s or seller’s market in Minnesota?
As of November 2023, the real estate market in key Minnesota counties, including Washington, Hennepin, Ramsey, and Dakota, leans towards a seller’s market. This is indicated by low months of inventory (ranging from 1.53 to 1.93 across these counties) and high list-to-sale price percentages, suggesting strong demand and favorable conditions for sellers.
Are home prices dropping in Minnesota?
In November 2023, the trend across Washington, Hennepin, Ramsey, and Dakota counties showed either stable or slightly increasing home prices. For instance, Washington County saw a 2.92% increase in median sold price, indicating that prices are not dropping significantly but are rather maintaining or increasing modestly.
Stillwater, MN Real Estate Market Update (October 2023)
Article Summary
In October 2023, the Stillwater, MN single-family home market saw significant activity. Sellers enjoyed a market where homes sold quickly and often above asking price, with the median sold price reaching $442,000. The market is leaning towards equilibrium, with a slight decrease in inventory and a stable increase in home values. This update provides a comprehensive look at the latest trends in the Stillwater real estate scene.
Stillwater, MN Real Estate Market Update for Single Family Homes (October 2023)
In the “Stillwater MN Real Estate Market Update” for October 2023, the local market has displayed a robust and dynamic environment. Whether you’re looking to buy or sell, understanding the pulse of the market is crucial, and this update aims to provide a clear picture of the trends. With a shift toward a more balanced market, we’ll explore what this means for single-family homes in the picturesque community of Stillwater.
Seller’s Market with Signs of Balance
As the leaves turned their autumn hues, the Stillwater market showed it’s still a great time for sellers, but not without a nod towards equilibrium. With a slight dip in the months of inventory to 2.54, we’re seeing that buyers are beginning to have a bit more selection to choose from, though sellers still enjoy the advantage of demand outpacing supply.
Key Market Indicators
-
-
- List to Sold Price Percentage: A stellar average of 102.5% over the asking price shows that homes are not just selling; they’re selling for more.
- Median Days in RPR: Houses are finding new owners in about 16 days, indicating a quick turnover in the market.
- Median Sold Price: Climbing to $442,000, the market is robust, reflecting a 29.28% increase month over month.
-
Understanding Home Values
Stillwater’s single-family homes aren’t just places to live; they’re investments that continue to grow. The median estimated property value now stands at $540,590, marking a steady climb over the past year.
The Tale of New and Active Listings
With new listings priced at a median of $575,000 and active listings even higher at $720,000, it’s clear that sellers are confident. Despite this, the number of new listings has surged by 35.4%, suggesting that there’s a healthy balance of new options coming onto the scene for eager buyers.
New Listings in Detail
| Detail | Data |
|---|---|
| Median List Price | $575,000 |
| Number of Properties | 31 |
| Median Living Area | 3,136 Sqft |
Active Listings Snapshot
| Detail | Data |
|---|---|
| Median List Price | $720,000 |
| Number of Properties | 63 |
| Median Living Area | 3,700 Sqft |
The Pending Sales Story
Even as prices rise, homes are moving from “For Sale” to “Sale Pending” at a lively pace. The market’s vibrancy is evident in the total dollar volume of pending listings, which has increased by a significant 31%.
Sold Listings: The Closing Chapter
For single-family homes that have changed hands, the final sale prices have been encouraging for sellers, with a substantial month-over-month growth in the total dollar volume of sold properties.
Inventory Insight
The supply of homes, measured in months of inventory, has slightly decreased, yet it’s still higher than last year. This subtle shift points towards a gentle nudge to a more balanced market, a positive sign for buyers without dampening the spirits of sellers.
Simple Takeaways
In layman’s terms, the Stillwater real estate market for single-family homes is hot, but not too hot for comfort. Sellers are getting excellent returns, and buyers have more choices than before. The market is moving fast, but not so fast that there isn’t time for careful consideration.
Thinking of making a move in the Stillwater market? Let’s translate these trends into a tailored strategy for you. Contact me here to start the conversation.
Until our next update, here’s to finding your place in the Stillwater market with confidence and clarity.
Frequently Asked Questions
- Is Stillwater, MN currently a seller’s market for single-family homes? A: Yes, as of October 2023, Stillwater, MN remains a seller’s market, but there are indications of a shift towards a more balanced market.
- How quickly are homes selling in Stillwater, MN? A: Single-family homes in Stillwater are selling relatively quickly, with a median of 16 days on the market as reported in October 2023.
- Have home prices in Stillwater, MN increased? A: Yes, there has been a noticeable increase in the median sold price of single-family homes, reflecting a 29.28% growth over the previous month.
- Where can I find more detailed statistics on Stillwater, MN’s real estate market? A: Detailed statistics can be found on the National Association of Realtors’ Realtors Property Resource® (RPR) website at narrpr.com.
Statistics for this market update were sourced from the National Association of Realtors’ Realtors Property Resource® (RPR). For more detailed information, please visit narrpr.com.
Stillwater, MN Real Estate Market Update (September 2023)
I’m Daniel Graves, your local Stillwater Realtor®, here to guide you through a delightful exploration of the Stillwater, MN real estate scene, with a special spotlight on the “Stillwater, MN Real Estate Market Update” for September 2023! Whether you’re a seasoned homeowner, a first-time buyer, a curious community member, or considering a move to our charming town, this update has something for everyone. Let’s dive into the key trends, statistics, and insights, all shared with clarity and a dash of fun, to explore what defined Stillwater’s real estate landscape during this engaging month.
Stillwater, MN 55082 Housing Market: A Friendly Overview
Imagine the Stillwater MN real estate market in September 2023 as a bustling town fair. Homes of various shapes and sizes, with a median sold price (think of it as the ticket price to your dream home) of $560,000, showcased a lively 30.23% jump from the previous month. But what does this all mean in simple terms? Let’s dive into some key points, with all the fun and none of the fuss!
Easy-Peasy Insights
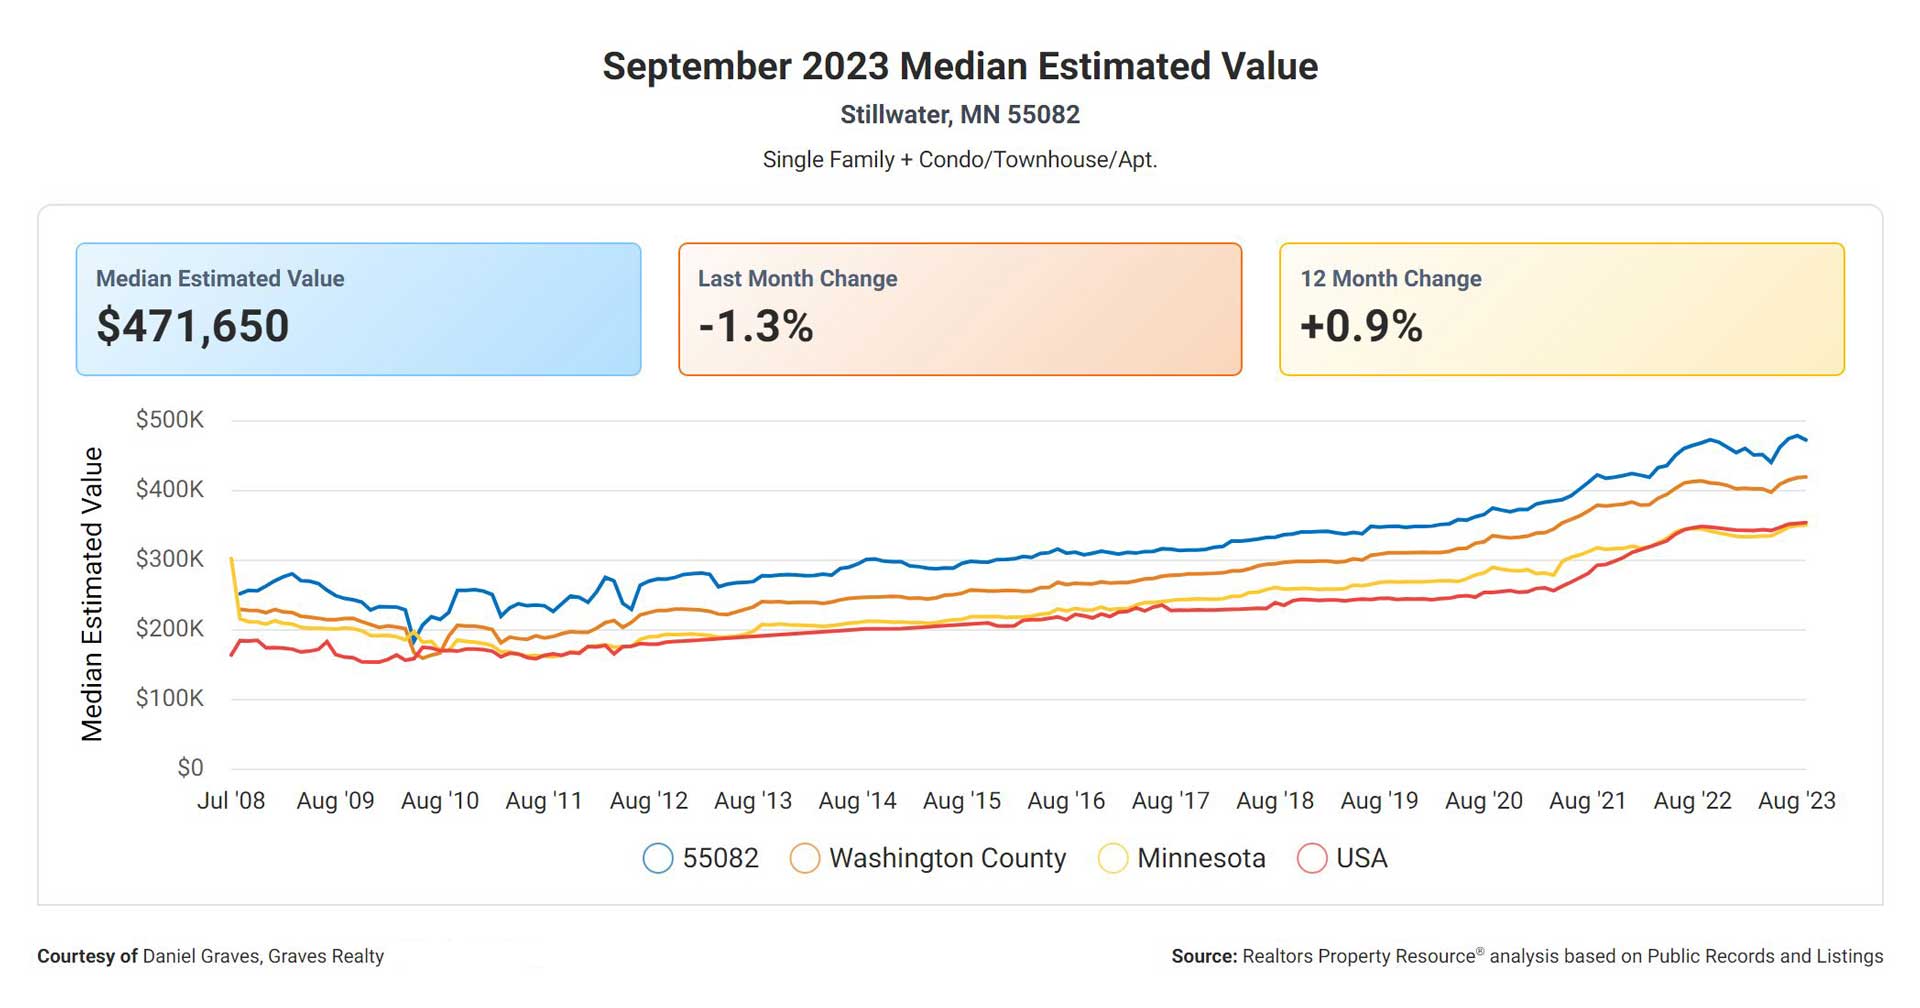
- Median Estimated Property Value: Envision this as the average price tag on homes in Stillwater, MN, which was $471,650. A tiny dip (-1.3%) from last month, but overall, holding steady!
- New Listings: Picture 58 new homes popping up on the block, with an average asking price of $499,425. That’s a 24.9% uptick from the previous month!
- Active Listings: 82 homes were up for grabs, each waving a price tag averaging $578,450, ready to welcome new owners.
- New Pending Listings: 57 homes found potential new owners, with deals in the works, at an average of $405,000.
Meet Daniel Graves: Your Stillwater MN Real Estate Guide
Embarking on a real estate journey in Stillwater, MN? Allow Daniel Graves to be your trusty guide! With a treasure trove of experience and a heart full of dedication to the Stillwater community, I’m here to help you navigate through your real estate adventures, whether you’re buying, selling, or simply exploring. Your dreams are my mission, and together, we’ll turn them into reality! Feel free to reach out anytime – I’m here to assist you!
Conclusion
The Stillwater, MN 55082 real estate market in September 2023 was a vibrant spectacle of opportunities and adventures for buyers and sellers alike. With homes finding new owners and new listings popping up, the market was a lively scene to behold. Whether you’re dreaming of a new home, planning to sell, or just enjoying the view, Daniel Graves is here to help you navigate through the enchanting world of Stillwater MN real estate, making every step of the journey a breeze!
FAQs: Curiosity Satisfied
- Is it a good time to buy or sell properties in Stillwater, MN 55082 in September 2023? A fabulous question! With prices on the rise, sellers might find joy, while buyers might want to explore their options with a keen eye!
- What are the current average home prices in Stillwater? The median sold price was a sparkling $560,000 in September 2023. A treasure waiting to be discovered!
Note: Your real estate journey is unique, and Daniel Graves is here to guide you with personalized advice and strategies tailored just for you in the Stillwater, MN real estate market!
Data Source: Realtors Property Resource®
Stillwater, MN Real Estate Market Update (August 2023)
Stillwater, MN Real Estate Market Update (August 2023)
Are you ready to dive into the captivating world of Stillwater, Minnesota’s real estate market? Whether you’re a buyer or a seller, the statistics and trends we’re about to explore will provide you with invaluable insights to make informed decisions in this dynamic market. In this comprehensive Stillwater real estate market update, we’ll delve into the latest data, revealing key factors that can help you navigate the Stillwater real estate landscape.
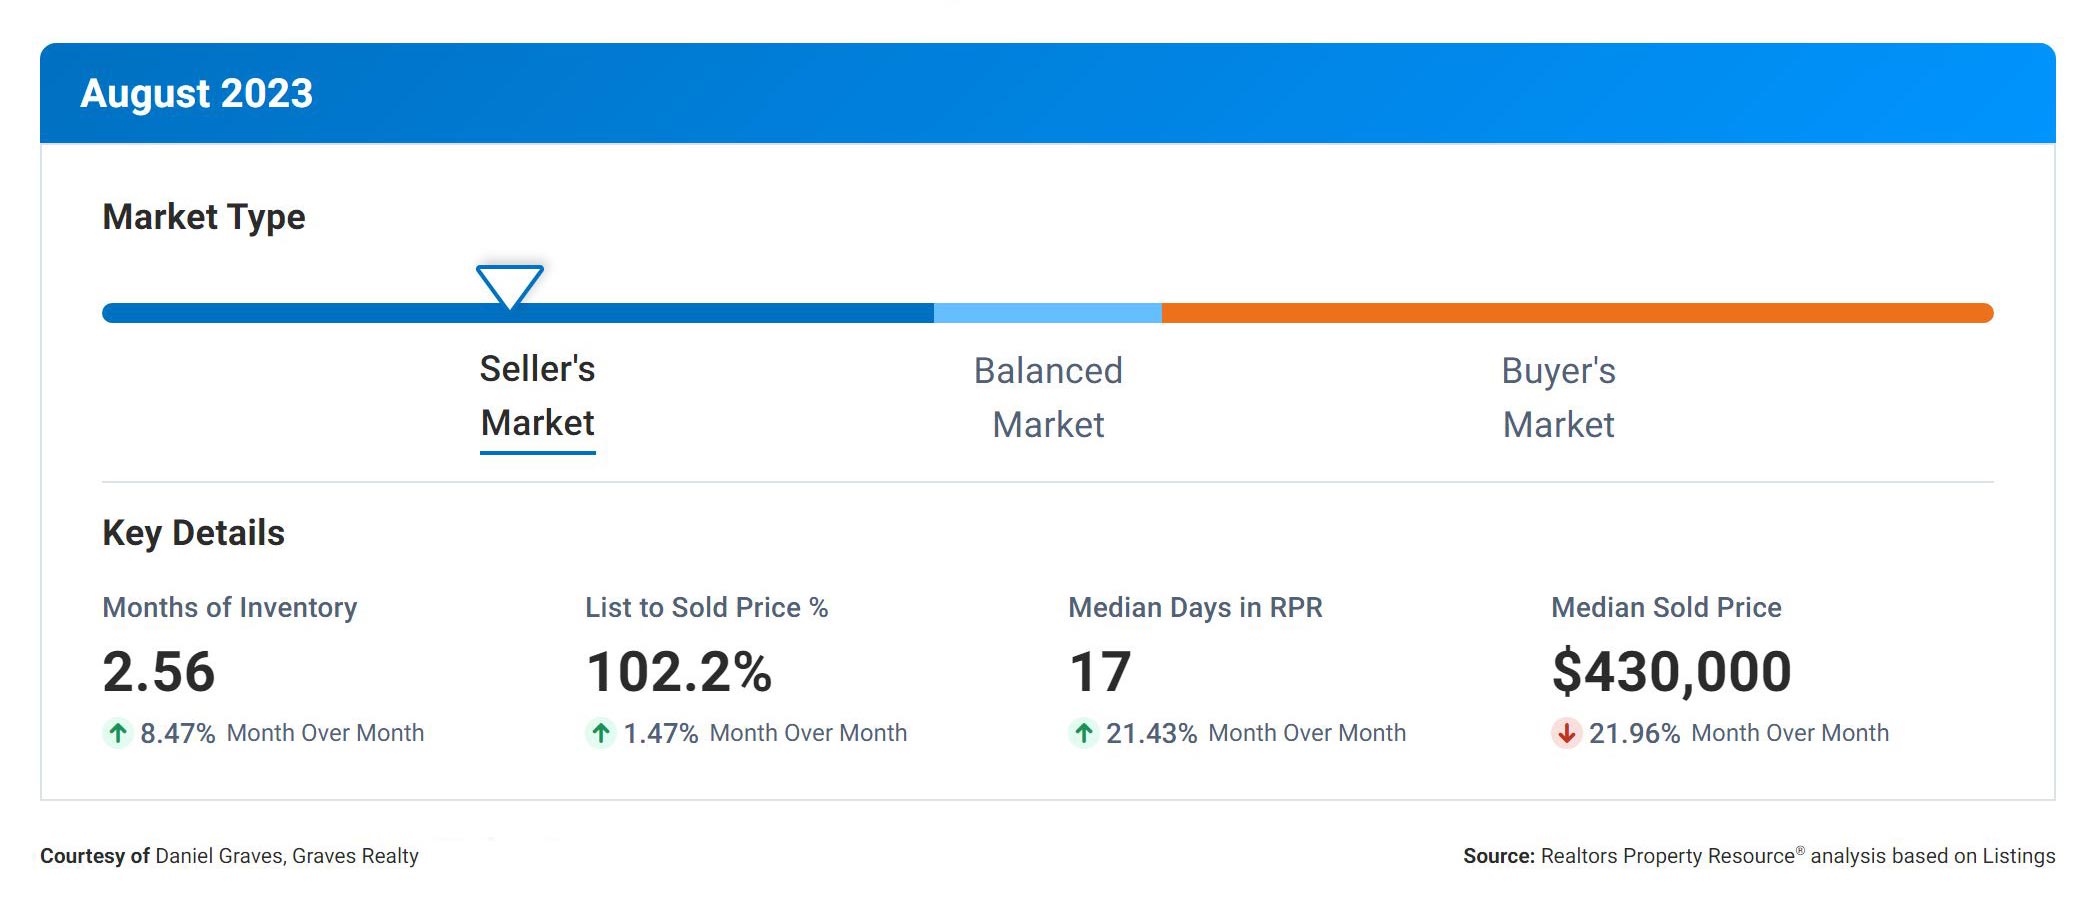
Months Supply of Inventory: 2.56 – A Seller’s Market
First, let’s look at the Months Supply of Inventory, a vital indicator of market conditions. Currently, it stands at an impressively low 2.56. This figure represents the number of months it would take to sell all the homes on the market if no new listings were added. A lower supply indicates a seller’s market, where demand surpasses availability. In this scenario, sellers hold a distinct advantage as buyers compete for a limited number of properties.
12-Month Change in Months of Inventory: A Notable 45.45% Increase
Now, here’s where it gets interesting. The 12-Month Change in Months of Inventory has experienced a substantial increase of 45.45% compared to the previous year. This means that, in the same period last year, it would have taken significantly fewer months to sell all available homes. This shift could potentially indicate a transition toward a more balanced or even a buyer’s market. Buyers, this might be your cue to celebrate!
Median Days Homes are On the Market: A Lightning-Fast 17 Days
Prepare to be amazed! The Median Days Homes are On the Market is a mere 17, which means that, on average, it takes just two weeks for a home to be sold once it hits the market. With homes selling at such a rapid pace, sellers can expect quick turnarounds and, quite possibly, multiple offers, making this an ideal market for sellers looking to make a move.
List to Sold Price Percentage: 102.2% – Sellers in the Lead
Now, let’s crunch some numbers. The List to Sold Price Percentage is a remarkable 102.2%. This percentage represents the average amount a home sells for compared to its original list price. In simpler terms, sellers are, on average, receiving slightly more than their asking price. This data underscores the eagerness of buyers to pay a premium to secure their dream home in the face of fierce competition.
Median Sold Price: A Strong $430,000
Lastly, we come to the Median Sold Price, which currently stands at an impressive $430,000. This figure represents the middle point of all sold prices in the market. It’s essential to clarify that this is not the average, but rather the price at which half of the homes sold above and half sold below. This data signals a robust market, with buyers willing to pay top dollar for their desired properties.
In Conclusion: A Dynamic Market with Opportunities for All
In conclusion, these real estate metrics paint an intriguing picture for the Stillwater Real Estate Market Update. The low Months Supply of Inventory and the Median Days Homes are On the Market indicate a highly competitive and fast-paced market that predominantly favors sellers. However, the significant increase in the 12-Month Change in Months of Inventory suggests a potential shift towards a more balanced or buyer-friendly market.
Moreover, the List to Sold Price Percentage exceeding 100% and the robust Median Sold Price demonstrate the willingness of buyers to invest generously in their dream homes. Whether you’re a buyer or a seller, these statistics provide valuable insights that can significantly inform your real estate decisions.
Remember, knowledge is power, and with these metrics at your disposal, you’re well-equipped to navigate the dynamic Stillwater real estate market. Happy buying and selling, everyone! Stay tuned for more updates as we continue to monitor this exciting market.
Click here to contact me with any questions.
Data source: www.narrpr.com